
We equate wealth with “net worth,” the sum total of your assets minus liabilities. Assets can include everything from an owned personal residence and cash in savings accounts to investments in stocks and bonds, real estate, and retirement accounts. Liabilities cover what a household owes: a car loan, credit card balance, student loan, mortgage, or any other bill yet to be paid. In the United States, wealth inequality runs even more pronounced than income inequality.
The Richest Americans
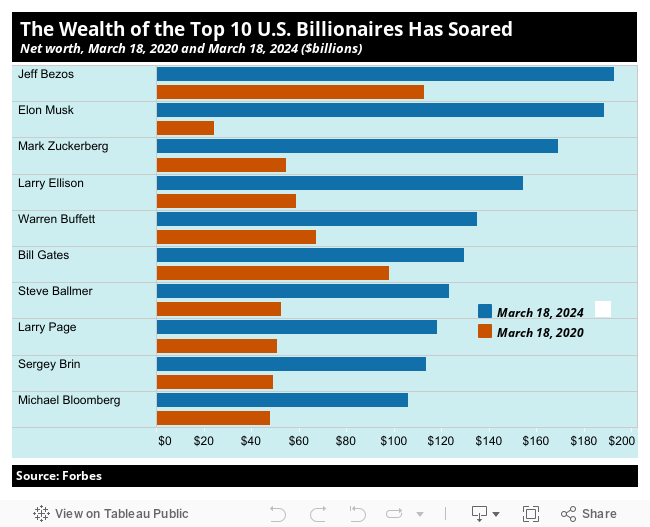
In 2020, only one U.S. billionaire — Amazon founder Jeff Bezos — had a net worth of $100 billion or more. Today, the entire top 10 are centi-billionaires, bringing their collective wealth to a staggering $1.4 trillion. Overall, the combined wealth of America’s billionaires has grown by 88 percent over the past four years to $5.529 trillion, according to Institute for Policy Studies calculations of Forbes Real Time Billionaire Data.
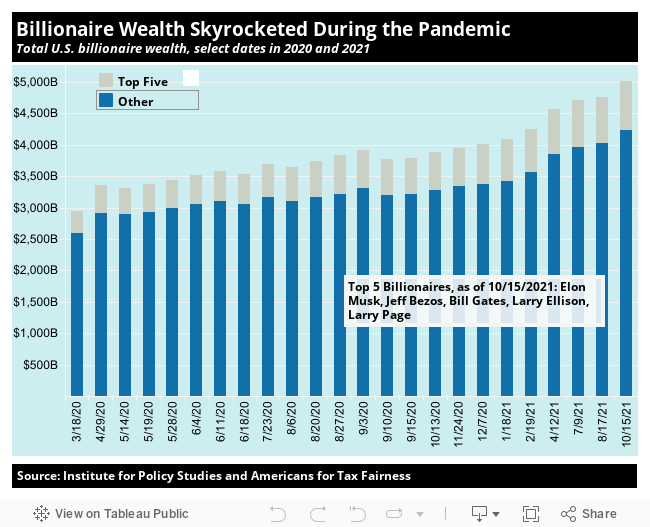
Even during the most intense period of the pandemic, as ordinary people around the world suffered from Covid-related health and economic crises, billionaires saw their fortunes expand. According to Institute for Policy Studies analysis of Forbes data, the combined wealth of all U.S. billionaires increased by $2.071 trillion (70.3 percent) between March 18, 2020 and October 15, 2021, from approximately $2.947 trillion to $5.019 trillion. Of the more than 700 U.S. billionaires, the richest five (Jeff Bezos, Bill Gates, Mark Zuckerberg, Larry Page, and Elon Musk) saw a 123 percent increase in their combined wealth during this period.
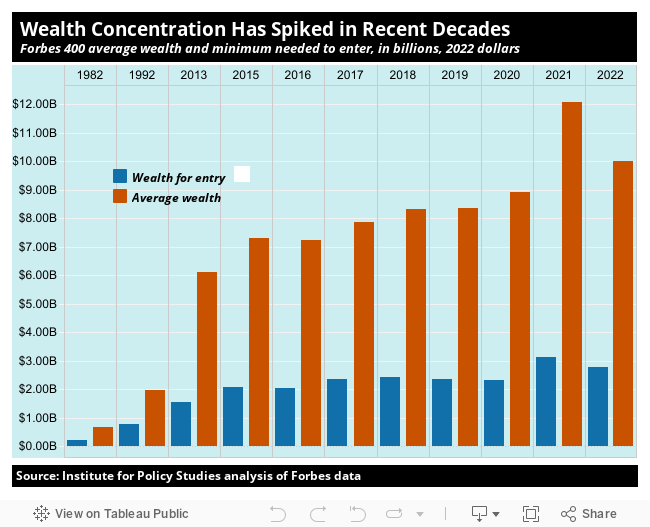
In 1982, the “poorest” American listed on the first annual Forbes magazine list of America’s richest 400 had a net worth of $220 million in 2022 dollars. The average member of that first list had a net worth of $670 million. In 2022, rich Americans needed a net worth of at least $2.77 billion to enter the Forbes 400, and the average member held a net worth of over $10 billion, nearly 15 times the 1982 average after adjusting for inflation.
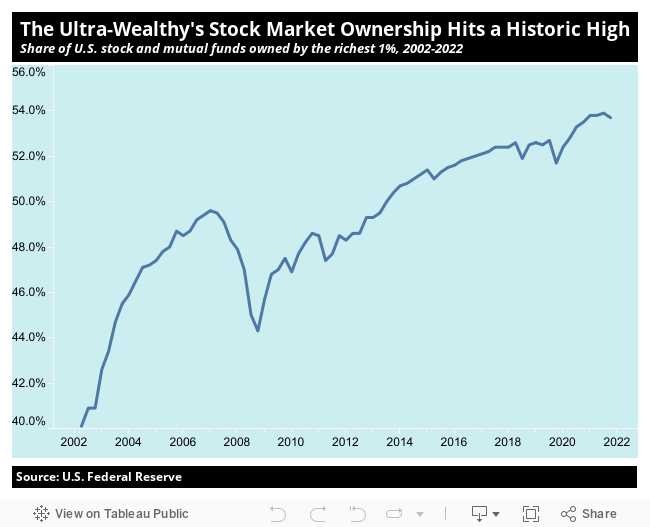
Another indicator of wealth concentration: In 2022, the ultra-wealthy’s share of stock market ownership hit at an all-time high. The richest 1 percent now own 54 percent of stock and mutual funds, up from 40 percent in 2002, according to Federal Reserve data.
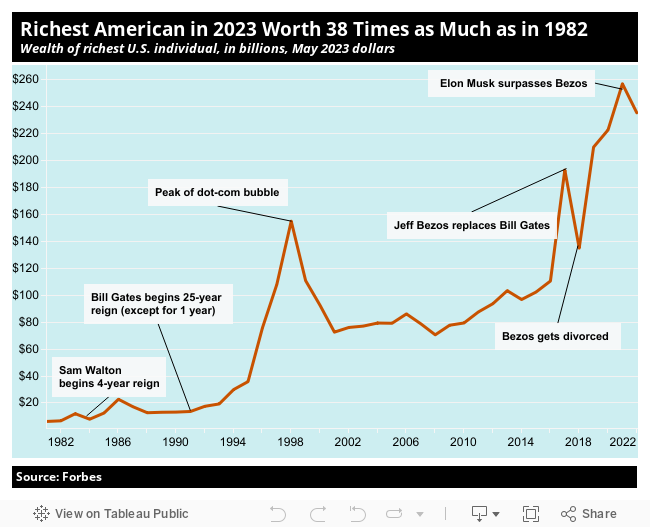
Inequality is skyrocketing even within the Forbes 400 list of America’s richest. As of May 2023, the net worth of the richest member of this group was 38 times larger than the net worth of the richest member in 1982 (in today’s dollars). Since 1982, just eight men have held this spot: shipping magnate Daniel Ludwig (1982), oil executive Gordon Getty (1983-1984), Walmart founder Sam Walton (1985-1988), media company owner John Kluge (1989-1991), Microsoft founder Bill Gates (1992-2017, except 1993), investor Warren Buffett (1993), Amazon founder Jeff Bezos (2018-2021), and Tesla CEO Elon Musk (2022).
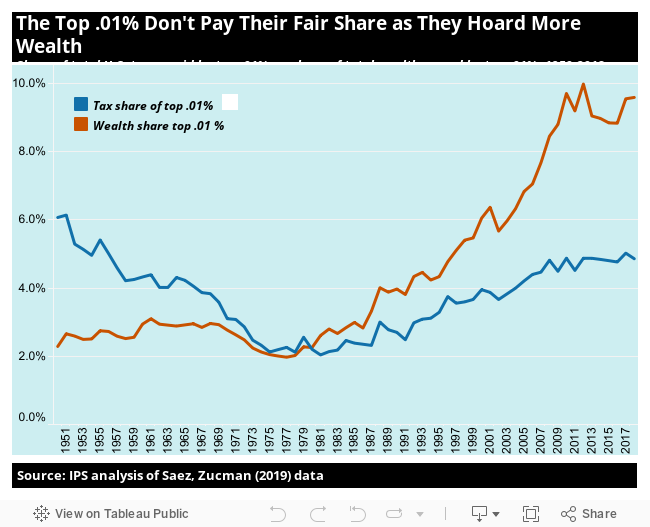
According to IPS analysis of Saez and Zucman data, as America’s richest .01 percent have accumulated more wealth, they have paid a smaller share of total U.S. taxes. In 2018, the tax share of the top .01 percent was close to what it was in 1953. By contrast, their share of the nation’s wealth nearly quadrupled during that period, rising from 2.5 percent to 9.6 percent.
Household Wealth
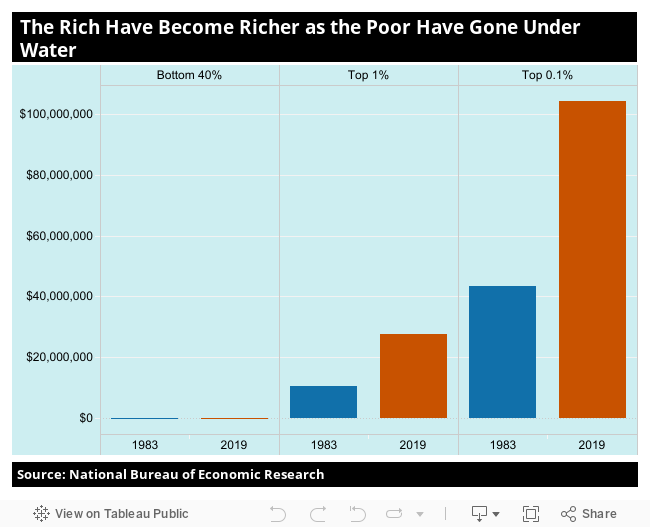
Over the past three decades, America’s most affluent families have added to their net worth, while those on the bottom have dipped into “negative wealth,” meaning the value of their debts exceeds the value of their assets, according to National Bureau of Economic Research data.
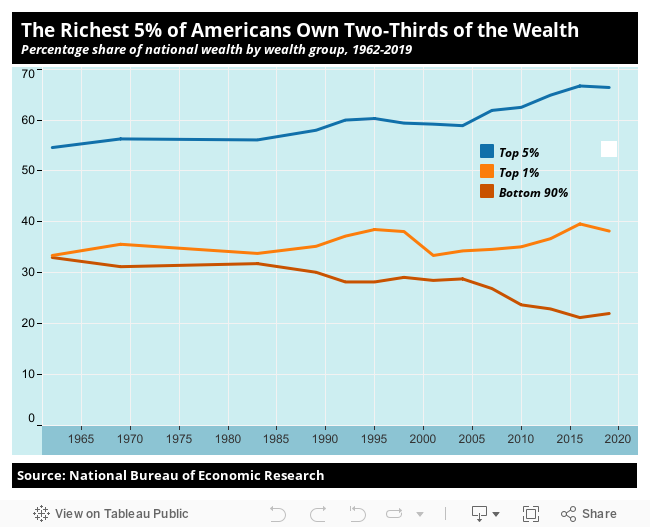
Over the past century, the National Bureau of Economic Research has found that the share of America’s wealth held by the nation’s wealthiest has changed markedly. That share peaked in the late 1920s, right before the Great Depression, then fell by more than half over the next three decades. But the equalizing trends of the mid 20th century have now been almost completely undone. At the top of the American economic summit, the richest of the nation’s rich now hold as large a wealth share as they did in the 1920s.
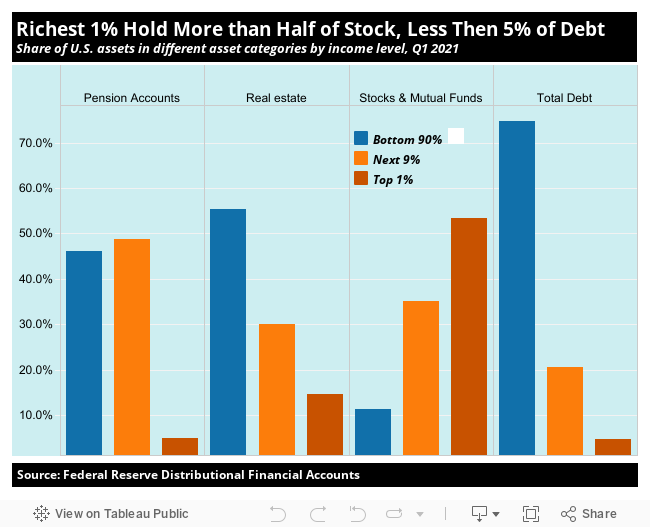
The rich don’t just have more wealth than everyone else. The bulk of their wealth comes from different — and more lucrative — asset sources, as the Federal Reserve’s Distributional Financial Accounts data shows. America’s top 1 percent, for instance, holds more than half the national wealth invested in stocks and mutual funds. Most of the wealth of Americans in the bottom 90 percent comes from their homes — the asset category that took the biggest hit during the Great Recession. These Americans also hold just around three-quarters of America’s debt.
The Racial Wealth Divide
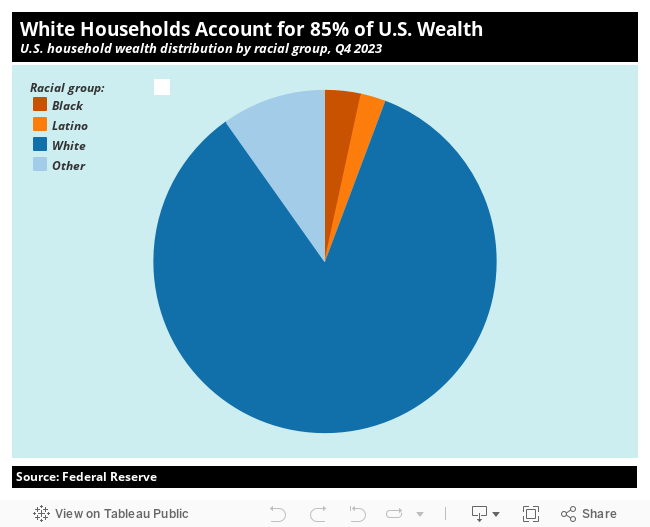
Public policies that favor white Americans and the very wealthy have perpetuated both the extreme concentration of wealth and an extreme racial wealth divide. According to the Federal Reserve, white households held 84.5 percent of all U.S. wealth as of the fourth quarter of 2023, while making up only 77 percent of households. By contrast, Black households held only 3.4 percent and Latinos held only 2.3 percent of national wealth. These wealth figures include the value of consumer durable goods, such as vehicles.
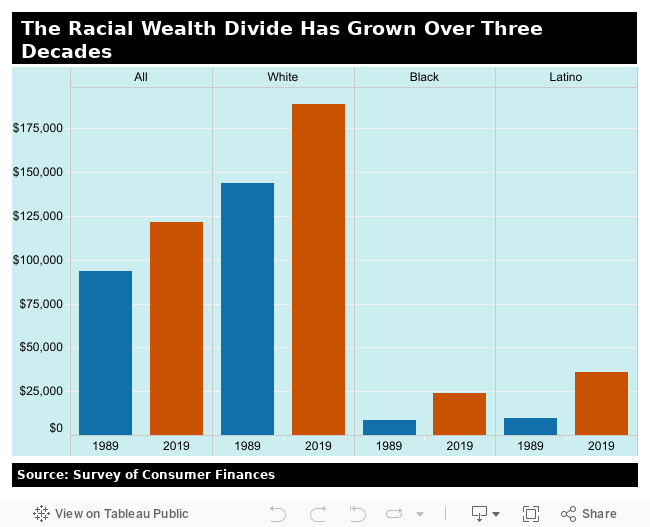
According to Survey of Consumer Finances data, the median Black family had $24,100 in wealth in 2019 (not including durable goods). This is just 12.7 percent of the $189,100 in wealth owned by the typical white family. The median Latino family, with $36,050, owns just 19.1 percent of the wealth of the median white family. The Institute for Policy Studies Racial Wealth Divide report provides more detail and proposed solutions.
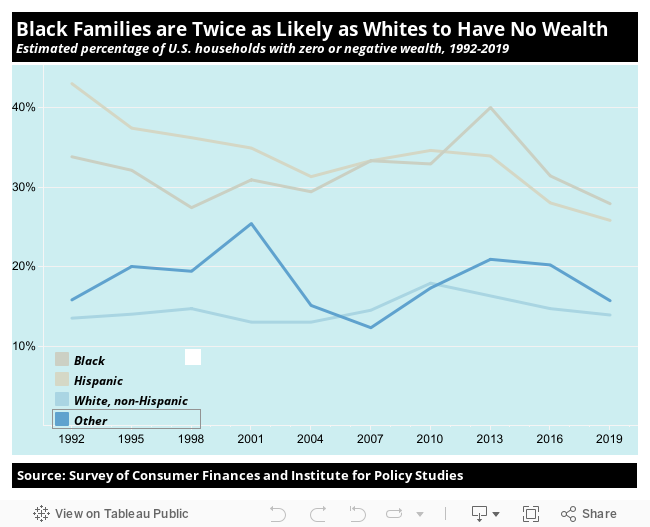
Families that have zero or even “negative” wealth (meaning the value of their debts exceeds the value of their assets) live on the edge, just one minor economic setback away from tragedy. Institute for Policy Studies analysis of Federal Reserve data shows that an estimated 28 percent of Black households and 26 percent of Latino households had zero or negative wealth in 2019, twice the level of whites.
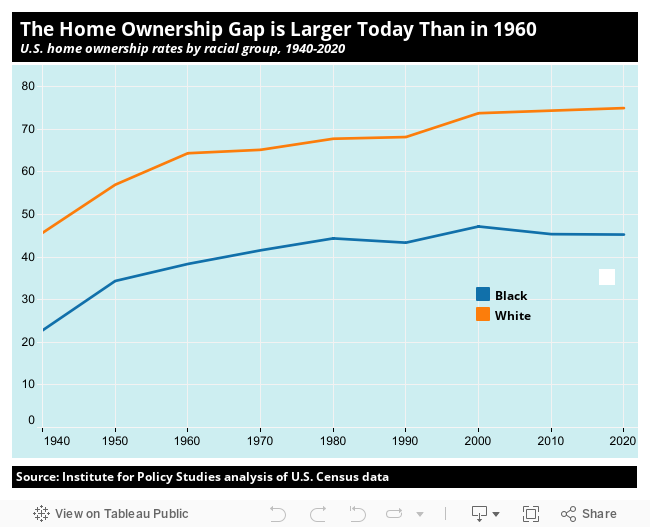
As with total wealth, home ownership is heavily skewed towards white families, our 2023 report with the National Community Reinvestment, Still a Dream, shows. Between 1960 and 2020, the rate of Black home ownership increased but the gap in ownership rates between Black and white families widened, from 26 percentage points to 30. Structural barriers, including lower incomes, higher rates of mortgage denials, and racial segregation, deny many Black families the opportunity to acquire this wealth-building asset.